Make your next people decision with evidence, not opinion.
OlaDigitalHub gives growing businesses a part-time analytics partner and the dashboards to go with it — so you know why people are leaving, where to hire next, and which teams need attention, every month, not once a year.
Clients don't hire a dashboard. They hire someone to answer the hard question.
An HR dashboard only helps when it is used to inform decisions. What's missing isn't a chart — it's someone who looks at the numbers every month and tells you what to do about them.
That's the job. Not "Power BI builder." Fractional People Analytics Partner.
Why are we losing people?
Attrition broken down by manager, tenure band, and regretted vs. non-regretted — not just a headline percentage.
Where should we hire next?
Workforce plans tied to revenue and workload, so headcount requests are backed by a number, not a hunch.
Which teams are underperforming?
Manager-level scorecards that flag risk early — engagement, absence, and attrition read together, not apart.
How healthy is our workforce?
One board-ready report a month, in plain English, so leadership stops asking HR to "pull some numbers."
Fractional People Analytics Partner
A part-time analytics function for companies too small for a Head of People Analytics but too data-heavy to keep guessing. You get a standing dashboard, a monthly board report, and a person to call when the CEO asks "why."
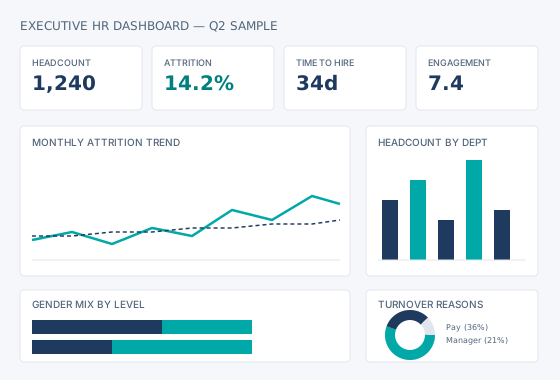
Don't need a partner yet? Start with a template.
Templates for building your own HR dashboards and executive reports, with sample data and setup guidance. Prices exclude applicable taxes; Payhip shows the final total before payment.
Executive HR Dashboard
An Excel dashboard and a Word guide for building a Power BI report; no finished .pbix file.
HR KPI Dictionary
60+ workforce metrics with formulas, DAX and SQL examples, and benchmark guidance.
Executive HR Report Template
The monthly board pack structure — narrative, charts, and the questions leadership actually asks.
Illustrative scenario: a 22% reduction in regrettable attrition
Explore how an attrition dashboard and manager scorecard could support retention decisions. Northfield Retail Group and the results shown are fictional.
Read the case studyIllustrative example: fictional company, synthetic data.
Bring evidence into your next people decision.
30 minutes. No slides. Bring one HR question you can't currently answer with data — we'll map out what it would take.
Book a Discovery Call