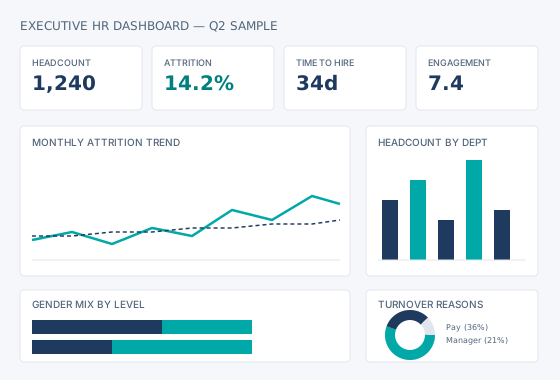
Illustrative scenario: a 22% reduction in regrettable attrition
Northfield Retail Group is a fictional company. The scenario, data and results were built to show the approach and do not describe a real client.
The challenge
Northfield's leadership knew overall turnover was high for retail, but every attempt to dig deeper hit the same wall: the existing headcount report blended voluntary and involuntary leavers, ignored tenure, and had no view by store manager. HR could report "attrition is up" — never why, or where.
Store managers with genuine retention problems looked identical, on paper, to ones losing people to store closures and internal transfers.
The approach
The first month went entirely into the data model: splitting leavers into regretted, non-regretted, and involuntary categories, and tying every exit to tenure band, manager, and store format.
From there, a Power BI dashboard replaced the old spreadsheet — refreshed monthly, with a manager-level scorecard so each store lead could see their own number before it reached a board pack.
Three views did most of the work
Regretted vs. non-regretted split
Overall attrition looked flat month to month. Splitting it revealed regretted attrition was rising steadily among 6–18 month tenure staff — the group most expensive to replace.
Manager scorecards
Twelve store managers had regretted attrition more than double the company average. Three hadn't run a stay interview in over a year.
Exit reason trends
"Pay" was the top stated reason company-wide, but "manager relationship" was the top reason inside the highest-attrition stores specifically.
The simulated result
Regrettable attrition fell from 18.6% to 14.5% over two quarters, concentrated in the twelve flagged stores. Regional managers used the scorecard in every monthly one-to-one with underperforming store leads — the dashboard didn't just report the problem, it became the coaching tool.
Illustrative example: fictional company, synthetic data.